This function computes the relative expression profiles.
In detail, the Relative Expression Profile is being computed as follows over developmental stages s:
$$f_s = (e_s - e_min)/(e_max - e_min)$$,
as follows over cells:
$$f_c = (e_c - e_min)/(e_max - e_min)$$,
as follows over celltypes:
$$f_ct = (e_ct - e_min)/(e_max - e_min)$$,
as follows over phylostrata:
$$f_ps = (e_ps - e_min)/(e_max - e_min)$$,
where e_min and e_max denote either the minimum/maximum mean expression level over developmental stages \(s\), cells \(c\), celltypes \(ct\) or phylostrata \(ps\).
This linear transformation corresponds to a shift by \(e_min - e_max\). As a result, the relative expression level \(f_s\) of developmental stage \(s\), \(f_c\) of cell \(c\), \(f_ct\) of celltype \(ct\) or \(f_ps\) of phylotstratum \(ps\) with minimum \(e_s\), \(e_c\), \(e_ct\) or \(e_ps\) is 0, whereas the relative expression level \(f_s\) of developmental stage \(s\), \(f_c\) of cell \(c\), \(f_ct\) of celltype \(ct \) or \(f_ps\) of phylotstratum \(ps\) with maximum \(e_s\), \(e_c\), \(e_ct\) or \(e_ps\) is 1, and the relative expression levels of all other stages \(s\), cells \(c\), celltypes \(ct\) or phylostrata \(ps\) range between 0 and 1.
REMatrix(
  ExpressionSet,
  Phylostratum = NULL,
  by = NULL,
  groups = NULL,
  split = 1e+05,
  showprogress = TRUE,
  threads = 1
)
Arguments
- ExpressionSet
expression object with rownames as GeneID (dgCMatrix) or standard PhyloExpressionSet object.
- Phylostratum
a named vector representing phylostratum per GeneID with names as GeneID (not used if Expression is PhyloExpressionSet).
- by
specify min/max transformation by row (stages, cells, celltypes) or by column (phylostratum)
- groups
specify stages or cells to be grouped into celltypes by a named list
- split
specify number of columns to split
- showprogress
boolean if progressbar should be shown
- threads
specify number of threads
Value
a numeric matrix storing the summed partial TEI values for each strata.
Details
The partial TEI values combined per strata give an overall
impression of the contribution of each
strata to the global TEI pattern.
References
Domazet-Loso T. and Tautz D. (2010). A phylogenetically based transcriptome age index mirrors ontogenetic divergence patterns. Nature (468): 815-818.
Quint M et al. (2012). A transcriptomic hourglass in plant embryogenesis. Nature (490): 98-101.
Drost HG et al. (2015) Mol Biol Evol. 32 (5): 1221-1231 doi:10.1093/molbev/msv012
Examples
## get Seurat object
celegans<-readRDS(file=system.file("extdata",
"celegans.embryo.SeuratData.rds", package="scTEI")
)
## load Caenorhabditis elegans gene age estimation
celegans_ps<-readr::read_tsv(
file=system.file("extdata",
"Sun2021_Orthomap.tsv", package="scTEI")
)
#> Rows: 20040 Columns: 2
#> ── Column specification ────────────────────────────────────────────────────────
#> Delimiter: "\t"
#> chr (1): GeneID
#> dbl (1): Phylostratum
#>
#> ℹ Use `spec()` to retrieve the full column specification for this data.
#> ℹ Specify the column types or set `show_col_types = FALSE` to quiet this message.
## define Phylostratum
ps_vec<-setNames(
as.numeric(celegans_ps$Phylostratum),
celegans_ps$GeneID
)
## get relative expression
Seurat::Idents(celegans)<-"embryo.time.bin"
reM<-REMatrix(
ExpressionSet=Seurat::GetAssayData(celegans, assay="RNA", layer="counts"),
Phylostratum=ps_vec
)
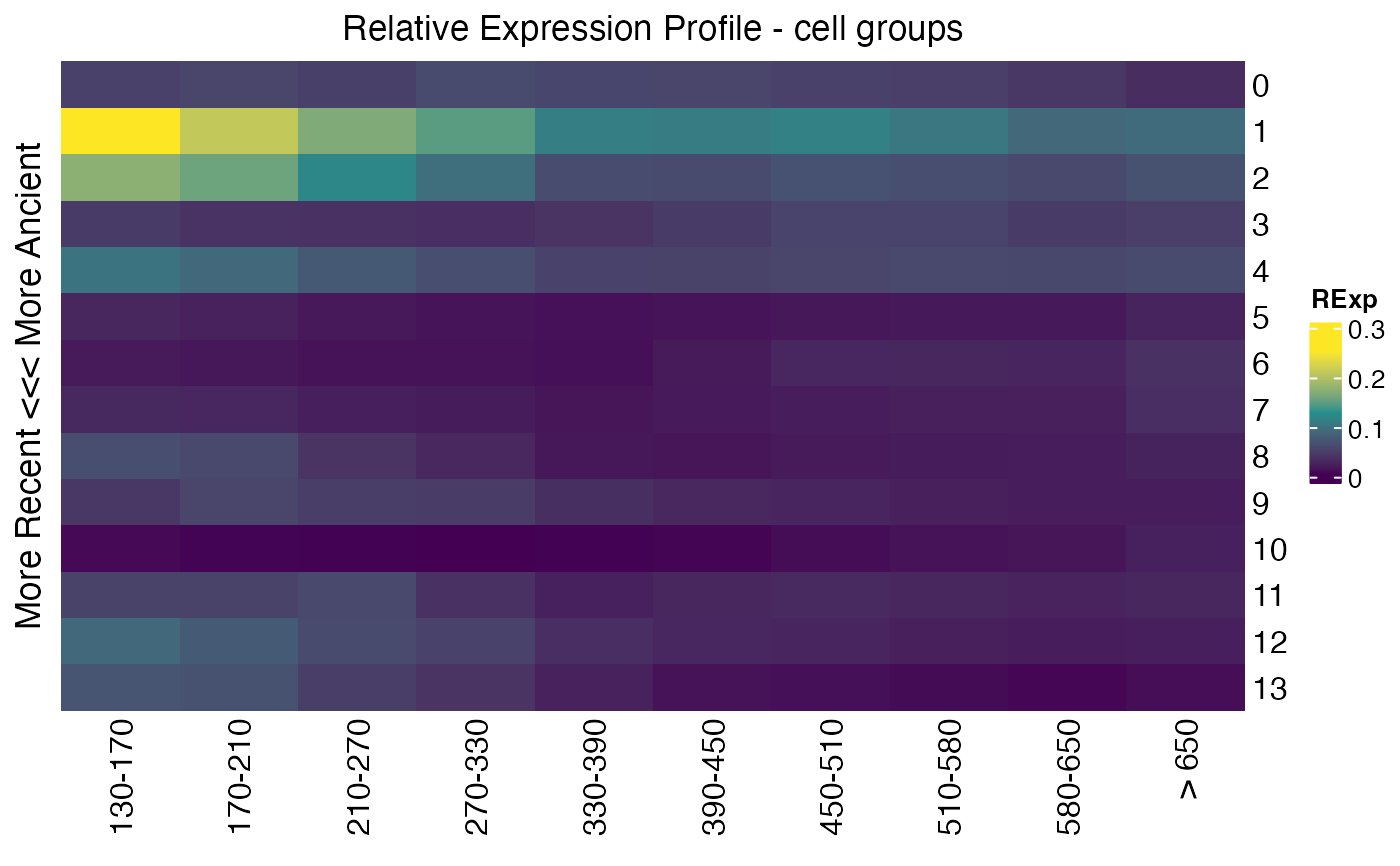
## get relative expression per cell group
Seurat::Idents(celegans)<-"embryo.time.bin"
cell_groups<-Ident2cellList(Seurat::Idents(celegans))
reM<-REMatrix(
ExpressionSet=Seurat::GetAssayData(celegans, assay="RNA", layer="counts"),
Phylostratum=ps_vec,
groups=cell_groups
)
p1<-ComplexHeatmap::Heatmap(
reM,
name="RExp",
column_title="Relative Expression Profile - cell groups",
row_title="More Recent <<< More Ancient",
cluster_rows=FALSE,
cluster_columns=FALSE,
col=viridis::viridis(3)
)
p1
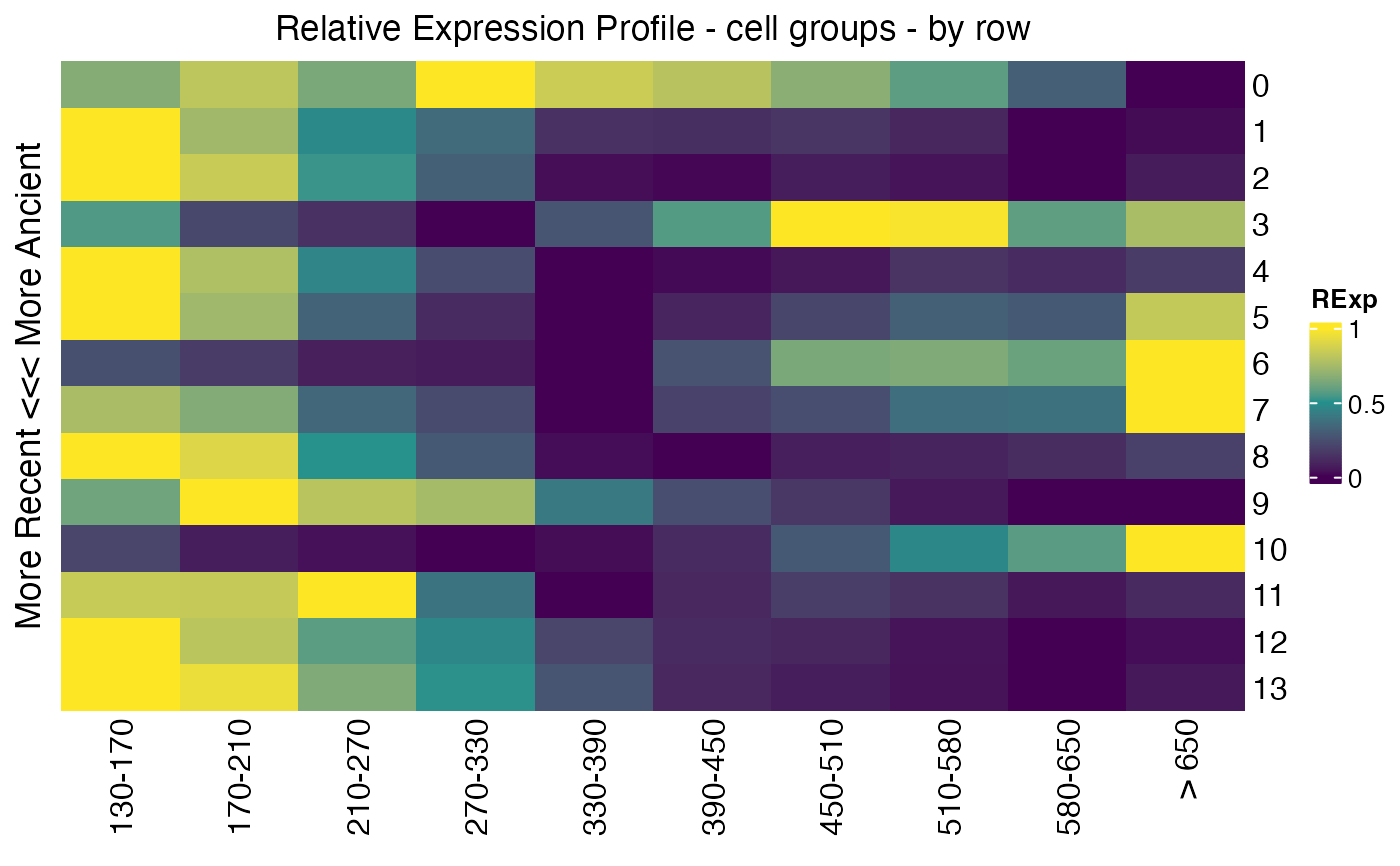
 ## get relative expression over stages per cell group
Seurat::Idents(celegans)<-"embryo.time.bin"
cell_groups<-Ident2cellList(Seurat::Idents(celegans))
reM<-REMatrix(
ExpressionSet=Seurat::GetAssayData(celegans, assay="RNA", layer="counts"),
Phylostratum=ps_vec,
groups=cell_groups,
by="row"
)
p2<-ComplexHeatmap::Heatmap(
reM,
name="RExp",
column_title="Relative Expression Profile - cell groups - by row",
row_title="More Recent <<< More Ancient",
cluster_rows=FALSE,
cluster_columns=FALSE,
col=viridis::viridis(3)
)
p2
## get relative expression over stages per cell group
Seurat::Idents(celegans)<-"embryo.time.bin"
cell_groups<-Ident2cellList(Seurat::Idents(celegans))
reM<-REMatrix(
ExpressionSet=Seurat::GetAssayData(celegans, assay="RNA", layer="counts"),
Phylostratum=ps_vec,
groups=cell_groups,
by="row"
)
p2<-ComplexHeatmap::Heatmap(
reM,
name="RExp",
column_title="Relative Expression Profile - cell groups - by row",
row_title="More Recent <<< More Ancient",
cluster_rows=FALSE,
cluster_columns=FALSE,
col=viridis::viridis(3)
)
p2
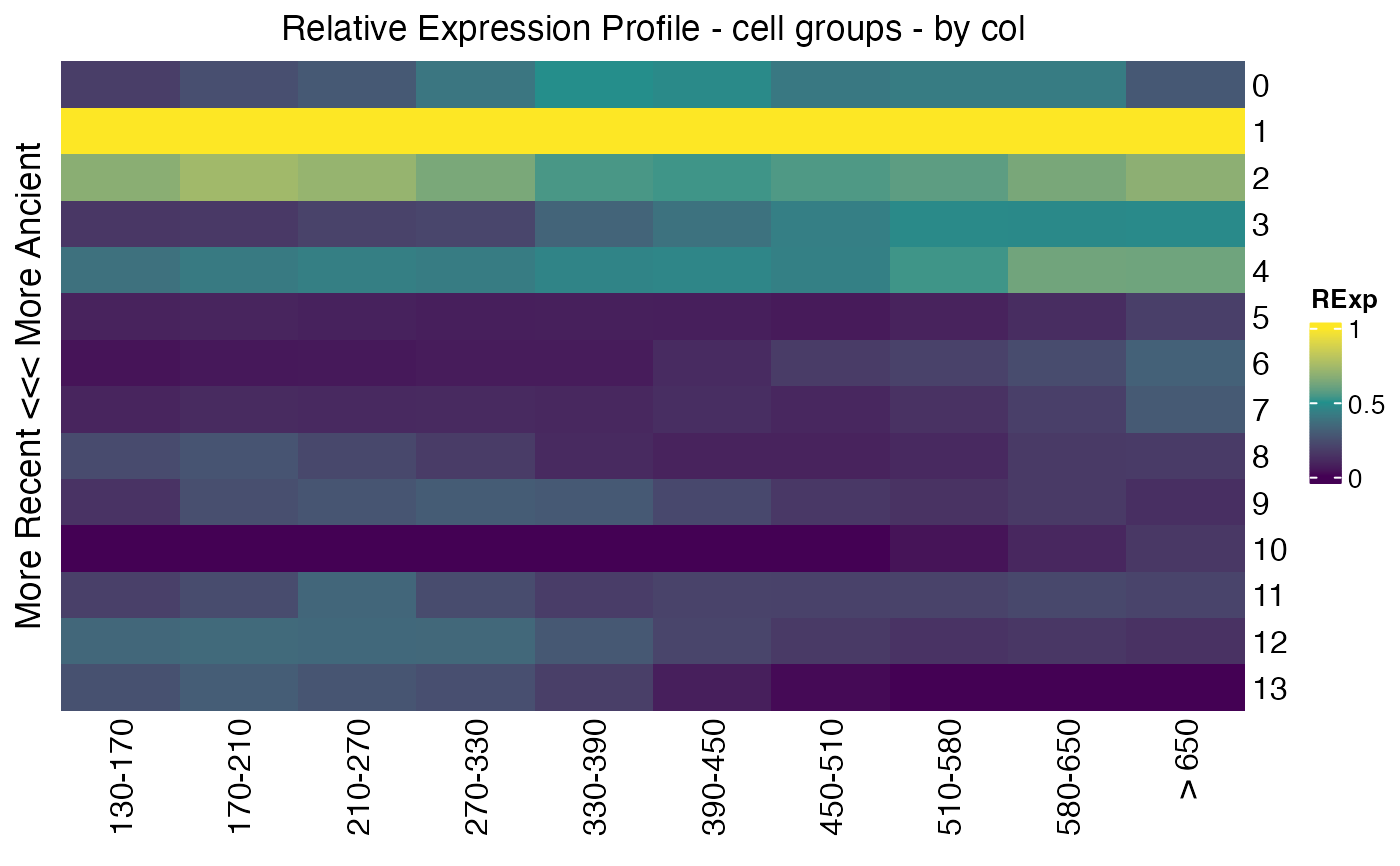
 ## get relative expression over phylostrata per cell group
Seurat::Idents(celegans)<-"embryo.time.bin"
cell_groups<-Ident2cellList(Seurat::Idents(celegans))
reM<-REMatrix(
ExpressionSet=Seurat::GetAssayData(celegans, assay="RNA", layer="counts"),
Phylostratum=ps_vec,
groups=cell_groups,
by="column"
)
p3<-ComplexHeatmap::Heatmap(
reM,
name="RExp",
column_title="Relative Expression Profile - cell groups - by col",
row_title="More Recent <<< More Ancient",
cluster_rows=FALSE,
cluster_columns=FALSE,
col=viridis::viridis(3)
)
p3
## get relative expression over phylostrata per cell group
Seurat::Idents(celegans)<-"embryo.time.bin"
cell_groups<-Ident2cellList(Seurat::Idents(celegans))
reM<-REMatrix(
ExpressionSet=Seurat::GetAssayData(celegans, assay="RNA", layer="counts"),
Phylostratum=ps_vec,
groups=cell_groups,
by="column"
)
p3<-ComplexHeatmap::Heatmap(
reM,
name="RExp",
column_title="Relative Expression Profile - cell groups - by col",
row_title="More Recent <<< More Ancient",
cluster_rows=FALSE,
cluster_columns=FALSE,
col=viridis::viridis(3)
)
p3